We work alongside nonprofits to assess their data systems, identify gaps, and build a roadmap for using data more effectively. The result is an organization that can track its own progress, report to funders with confidence, and make better decisions — with or without us in the room.
The Concept
Consider a nonprofit adult education program that collects valuable data on participant progress but struggles to make sense of it internally or communicate it to donors. A data capacity engagement starts by understanding what data exists, how it’s collected, and what decisions it needs to support..
The Sample Solution
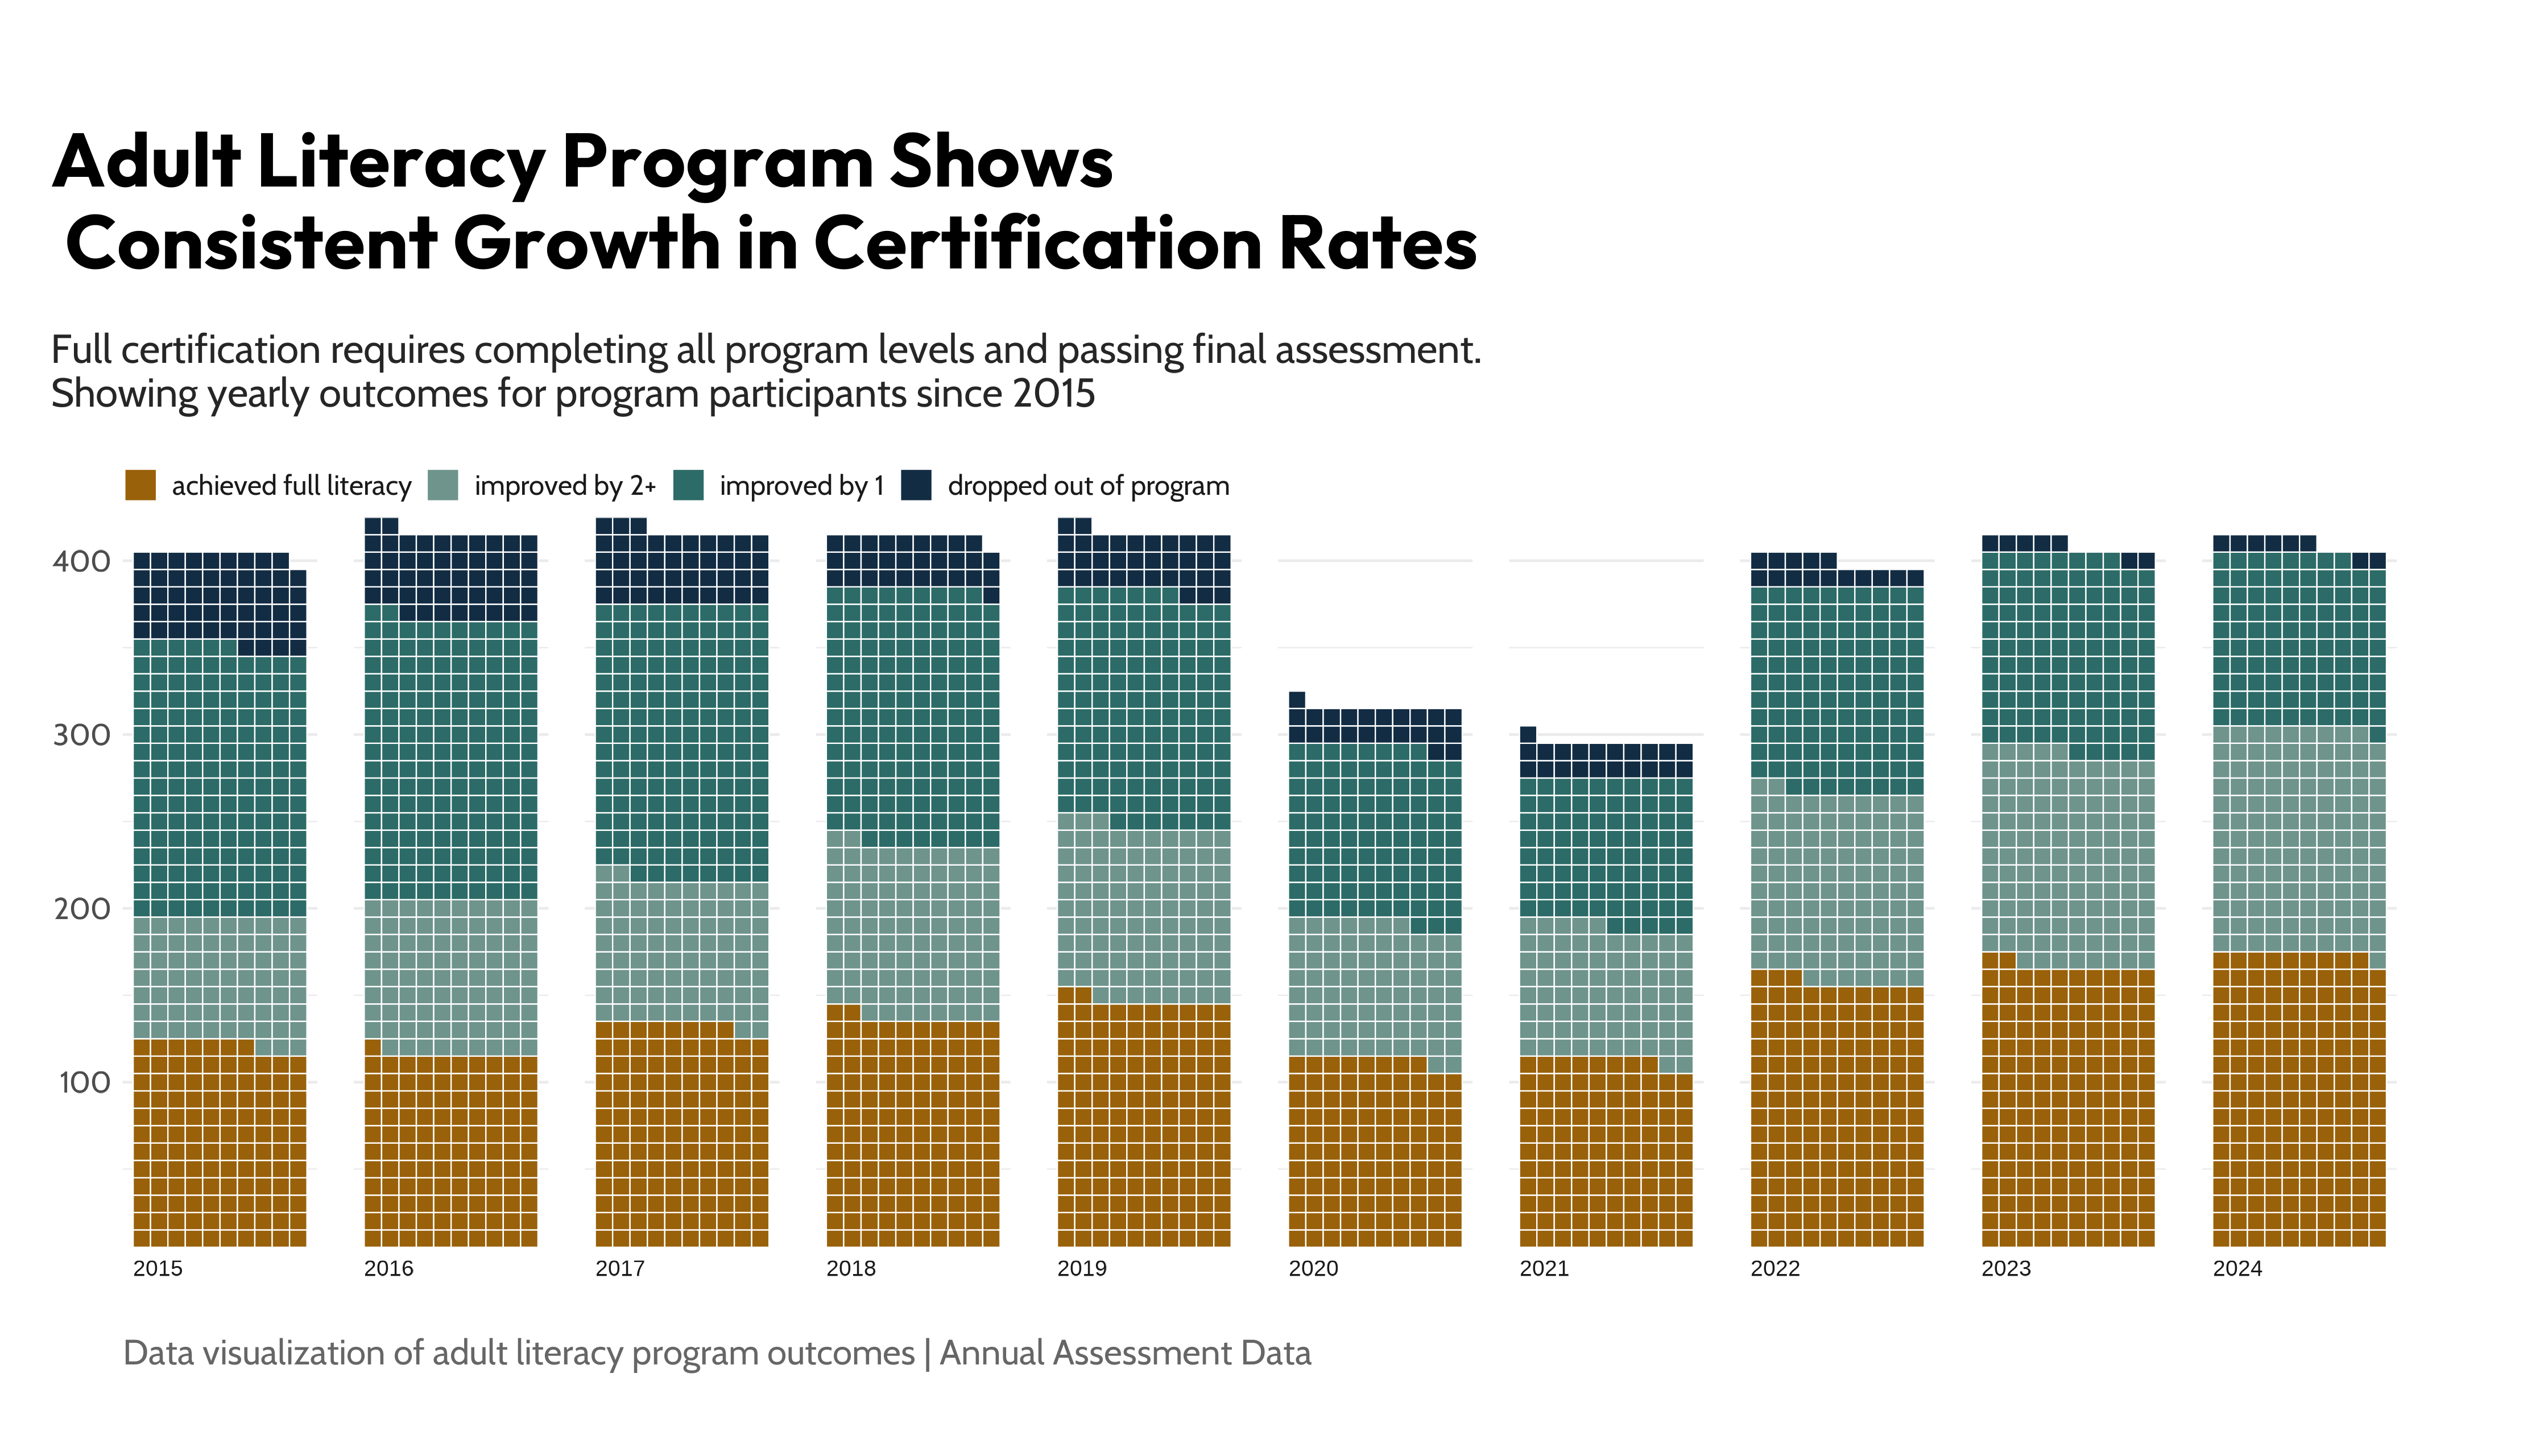
In this demonstration, we created a time series visualization using waffle charts, where:
- Each bar represents a program year
- Each square represents a participant
- A thoughtful color scheme tracks theoretical participant achievement:
- Full literacy certification (brownish gold)
- 2+ grade level improvement (teal)
- 1 grade level improvement (light green)
- Dropped out of program (dark blue)
What Capacity Building Delivers
- Staff who can pull, analyze, and interpret their own data
- Reporting systems that don’t depend on outside consultants
- Visualizations your team can update and own
- Data-driven conversations with funders and boards
Why This Approach Works
A data capacity engagement isn’t a one-time deliverable — it’s a shift in how your organization relates to its own data. We build the systems, skills, and confidence that make that shift permanent.
Ready to Tell Your Story?
Every engagement starts with a conversation about where your organization is today and where you want to go.
[Contact Us] to talk about building your data capacity.
This example demonstrates one of many visualization techniques we could use to help nonprofits communicate their impact effectively. The visualization uses simulated data to illustrate the concept.

